Conference Presentation
Model Drift Analysis in Real-World Use of an AI Breast Cancer Screening Software
RSNA 2022
Jorge Onieva, MSc, Leeann Louis, Benjamin Reece, Greg Sorensen, William Lotter
November 28, 2022
Purpose
Model drift is a challenge in artificial intelligence (AI) where an AI model’s behavior changes over time due to a number of possible factors including changes in the input data distribution. (for example, changes in a screening population over time). We analyzed the performance of a commercially-available AI triage software for mammography to assess the stability of the software’s outputs in real-world clinical use. The software was deployed for one year across a large number of screening exams, allowing a comparison of the AI model’s outputs over time.
Materials and Methods
A total of 303,222 studies (302,612 Digital Breast Tomosynthesis and 610 Full-Field Digital Mammography) were predicted to be “suspicious” or “not suspicious” by the software in 66 different clinical settings across the United States. We aggregated the AI model’s predictions per month (from May 2021 to April 2022) and calculated the proportion of studies classified as “suspicious” at each of the 3 possible operating points used by the software. 95% confidence intervals for the proportions were computed using the Wilson method, as well as a standard deviation of the proportions across the 12 months. Finally, we investigate the similarity of the distributions by computing the Jensen-Shannon distance between the proportions during the first and last 6 months of use of the software. This distance is defined in a [0-1] range, where 0 indicates identical distributions.
Results
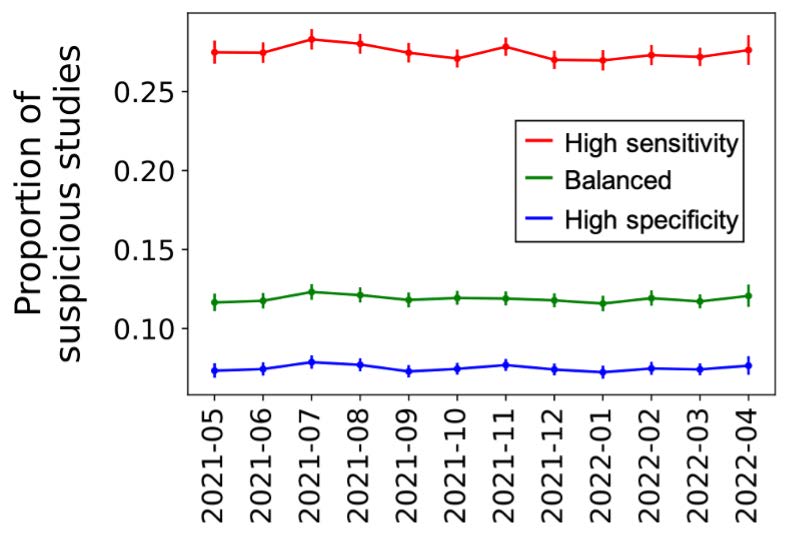
The proportion of cases classified as “suspicious” each month remained stable over the course of the year. For each operating point, the standard deviation of the proportion over the 12 months was 0.0041, 0.0021, and 0.0019 respectively. Across all months, the proportions were within a range of 0.015 (1.5%) of each other for each operating point, meaning that the proportion for any given month was less than 1.5% different than any other month for the same operating point. The Jensen-Shannon distance for the proportions between the first and second 6 month periods were all very close to zero for all three operating points: 0.0153, 0.00935, and 0.00808, further quantifying that the proportion of studies outputted as “suspicious” at each operating point remained stable over time.

Figure 1.
Proportion of studies classified as “suspicious” for the software with 95% confidence intervals (Wilson method). Each line represents one operating point.
Conclusions
The proportion of cases classified as “suspicious” by the AI model remained stable over a full year of deployment, indicating that no significant model drift was observed.
Clinical Relevance
AI has the potential to improve screening mammography, but to do so, it must be reliable and robust over time. These results indicate AI model stability at a scale that has not been previously measured.